The figures
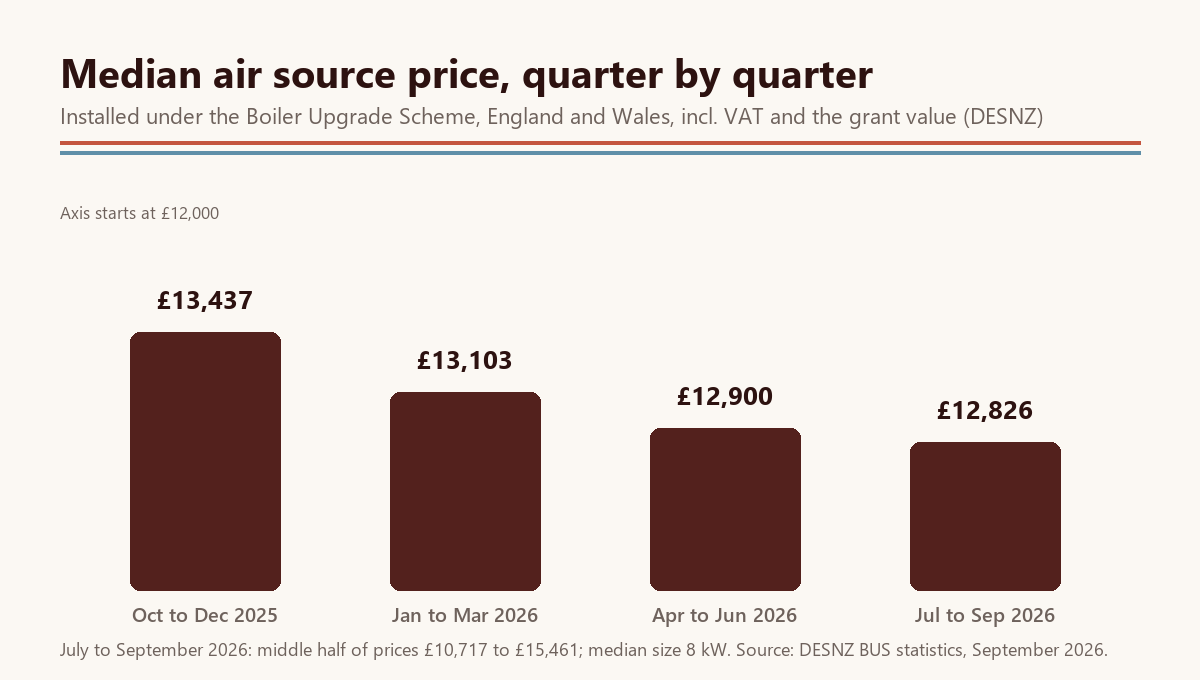
| Quarter | Median price | After £7,500 |
|---|---|---|
| Oct to Dec 2025 | £13,437 | £5,937 |
| Jan to Mar 2026 | £13,103 | £5,603 |
| Apr to Jun 2026 | £12,900 | £5,400 |
| Jul to Sep 2026 | £12,826 | £5,326 |
In the latest quarter, July to September 2026, half of all grant-funded air source installations cost between £10,717 and £15,461, and the median size was 8 kW. The figures come from the September 2026 release, published on 29 October 2026.
What these prices measure
Each figure is the middle value of the installed prices that MCS certified installers recorded on their certificates for jobs claimed under the Boiler Upgrade Scheme. They cover the system, the labour and VAT, and DESNZ says they should include the grant value, though installers may interpret that differently. Zero costs and the top and bottom tenth of prices are removed first, so one extreme job cannot drag the median.
Because the scheme covers England and Wales, these are national figures. There is no official breakdown by region or by type of house, and the figures do not say what share of each price went on radiators, cylinders or labour.
How to read a small change
A fall of £611 over a year is about 4.5% of the price. That is real but modest, and it is smaller than the gap between two quotes for the same house in many cases: the middle half of prices in the latest quarter spans more than £4,700. So the trend says something about the market as a whole, and very little about what your own installation should cost. DESNZ also reports that, after allowing for inflation, the latest median is 14% lower than in July to September 2022.
Two other things move the median that have nothing to do with prices going up or down: the mix of sizes being installed in a quarter, and late claims, which DESNZ adds in later releases. When a new release comes out, the earlier quarters can shift a little.
Why the mix of sizes matters
Because a bigger heat pump costs more, a quarter in which more large systems are installed will show a higher median even if no installer changed their prices. The yearly figures by size show how wide that spread is: a median of £12,164 for 6 to 8 kW against £15,366 for 12 to 14 kW. So a fall in the overall median could come partly from more small homes having heat pumps fitted. The size-band figures, published for the financial year, are the better way to compare like with like.
Ground source
Ground source figures are much less steady because so few are installed. The median was £27,232 in April to June 2026 and £34,630 in July to September, while the figure for the whole of April 2025 to March 2026 was £26,500 across a sample of 365. For ground source, the yearly figure is the better guide. Our ground source installation page explains the ground works behind the higher price.
Using the figures with a quote
The quarterly median is a sense check, not a target. The better comparison for your own quote is the median for your size band, which the installation cost planner shows alongside the grant and your scheme dates. If your quote is well above the median for its size, the quote should explain why, usually through radiator work, the cylinder, a difficult pipe run or an electrical upgrade. Our page on how the figures are collected explains the limits in more detail.